

Pancreatic Cancer Outcomes at KFSYSCC
Between 2015-2019, the five-year survival rate for pancreatic cancer at KFSYSCC was 5.6%.
Basic Information and Stage Distribution of 586 Pancreatic Cancer Patients at KFSYSCC from 1990-2019
| Total | 1990-1994 | 1995-1999 | 2000-2004 | 2005-2009 | 2010-2014 | 2015-2019 | |
|---|---|---|---|---|---|---|---|
| n | 586 | 16 (3%) | 36 (6%) | 130 (22%) | 130 (22%) | 129 (22%) | 145 (25%) |
| Gender (%) | |||||||
| Male | 318 (54%) | 12 (75%) | 17 (47%) | 73 (56%) | 72 (55%) | 65 (50%) | 79 (54%) |
| Female | 268 (46%) | 4 (25%) | 19 (53%) | 57 (44%) | 58 (45%) | 64 (50%) | 66 (46%) |
| Age | |||||||
| Mean/Median | 60/60 | 57/58 | 60/60 | 58/58 | 60/60 | 61/60 | 62/63 |
| Range | 24-92 | 36-74 | 39-89 | 26-83 | 27-87 | 32-92 | 24-85 |
| Q1-Q3 | 53-68 | 52-65 | 48-70 | 49-68 | 54-68 | 54-67 | 56-70 |
| Stage (%) | |||||||
| I | 21 (4%) | 0 (0%) | 2 (6%) | 6 (5%) | 4 (3%) | 3 (2%) | 6 (4%) |
| II | 47 (8%) | 0 (0%) | 0 (0%) | 2 (2%) | 15 (12%) | 12 (9%) | 18 (12%) |
| III | 62 (11%) | 0 (0%) | 2 (6%) | 3 (2%) | 20 (15%) | 17 (13%) | 20 (14%) |
| IV | 373 (64%) | 6 (38%) | 13 (36%) | 79 (61%) | 80 (62%) | 95 (74%) | 100 (69%) |
| Unknown | 83 (14%) | 10 (63%) | 19 (53%) | 40 (31%) | 11 (8%) | 2 (2%) | 1 (1%) |
Based on KFSYSCC's cancer registry from 1990 to 2019, there were 586 analytic pancreatic cancer cases, with 318 males (54%) and 268 females (46%). The average and median ages were 60 and 60 years old, respectively; the youngest patient was 24 years old, and the oldest was 92 years old; the interquartile range (Q1-Q3) was 53-68. By stage, there were 21 stage I patients (4%), 47 stage II patients (8%), 62 stage III patients (22%), and 373 stage IV patients (64%). The table above presents the basic patient information and stage distribution, categorized by the year of diagnosis.
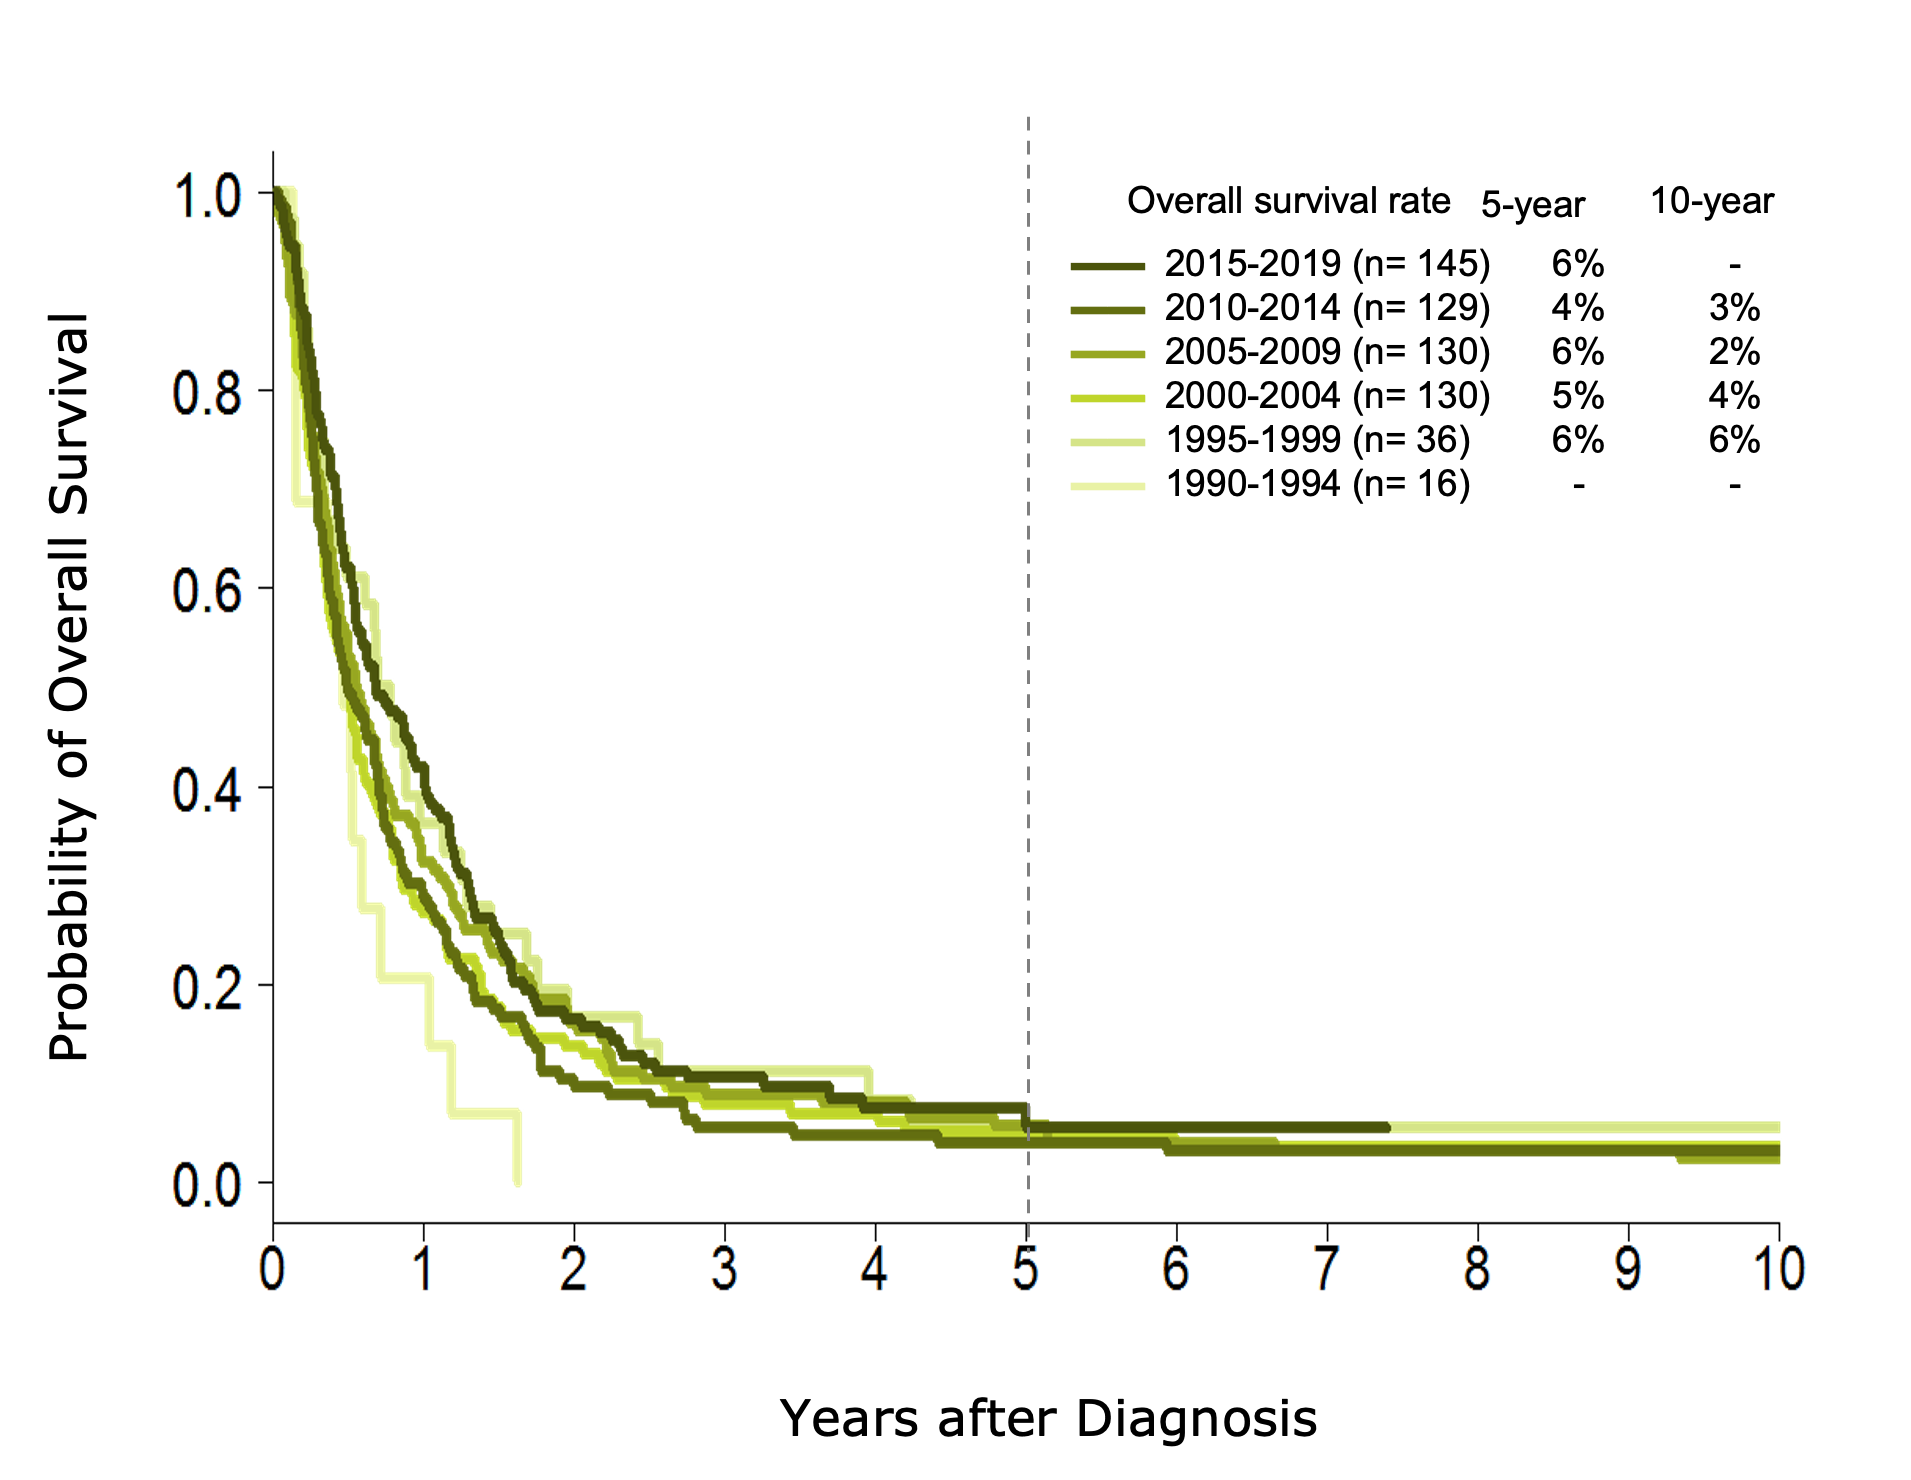
Survival Curves for 586 Pancreatic Cancer Patients (1990-2019), Stratified by Year of Diagnosis
From 1990 to 2019, the chart illustrates the five-year observed survival rates for 586 pancreatic cancer patients at KFSYSCC, stratified by the year of diagnosis. The graph shows the five-year survival rate for pancreatic cancer remained flat from 6% in 1990-1994 to 6% in 2015-2019, while the ten-year survival rate decreased from 6% in 1990-1994 to 3% in 2010-2014.
Treatment Methods and Stages for 145 Pancreatic Cancer Patients at KFSYSCC (2015-2019)
| Treatment Type | Total | Stage I | Stage II | Stage III | Stage IV | Unknown |
|---|---|---|---|---|---|---|
| Total | 145 | 6 | 18 | 20 | 100 | 1 |
| Surgical Treatment | 19 (13%) | 3 (50%) | 11 (61%) | 3 (15%) | 2 (2%) | 0 (0%) |
| Radiation Therapy | 14 (10%) | 0 (0%) | 4 (22%) | 2 (10%) | 8 (8%) | 0 (0%) |
| Chemotherapy | 120 (83%) | 4 (67%) | 15 (83%) | 19 (95%) | 82 (82%) | 0 (0%) |
| Targeted Therapy | 1 (1%) | 0 (0%) | 0 (0%) | 0 (0%) | 1 (1%) | 0 (0%) |
| Hormone Therapy | 4 (3%) | 0 (0%) | 0 (0%) | 0 (0%) | 4 (4%) | 0 (0%) |
| Palliative Care | 58 (40%) | 0 (0%) | 3 (17%) | 8 (40%) | 47 (47%) | 0 (0%) |
| Bone Marrow/Stem Cell Transplant | 0 (0%) | 0 (0%) | 0 (0%) | 4 (25%) | 9 (33%) | 1 (7%) |
| No Record of Initial Treatment Reported | 1 (1%) | 0 (0%) | 0 (0%) | 0 (0%) | 0 (0%) | 1 (100%) |
Between 2015 and 2019, there were a total of 145 analytic pancreatic cancer cases, including 6 patients in stage I, 18 in stage II, 20 in stage III, and 100 in stage IV. In terms of treatment methods, 19 patients (13%) underwent surgical treatment, 14 (10%) received radiation therapy, 120 (83%) underwent chemotherapy, 1 (1%) received targeted therapy, 4 (3%) received hormone therapy, 58 (40%) underwent palliative care, and 1 (1%) had no record of initial treatment reported.
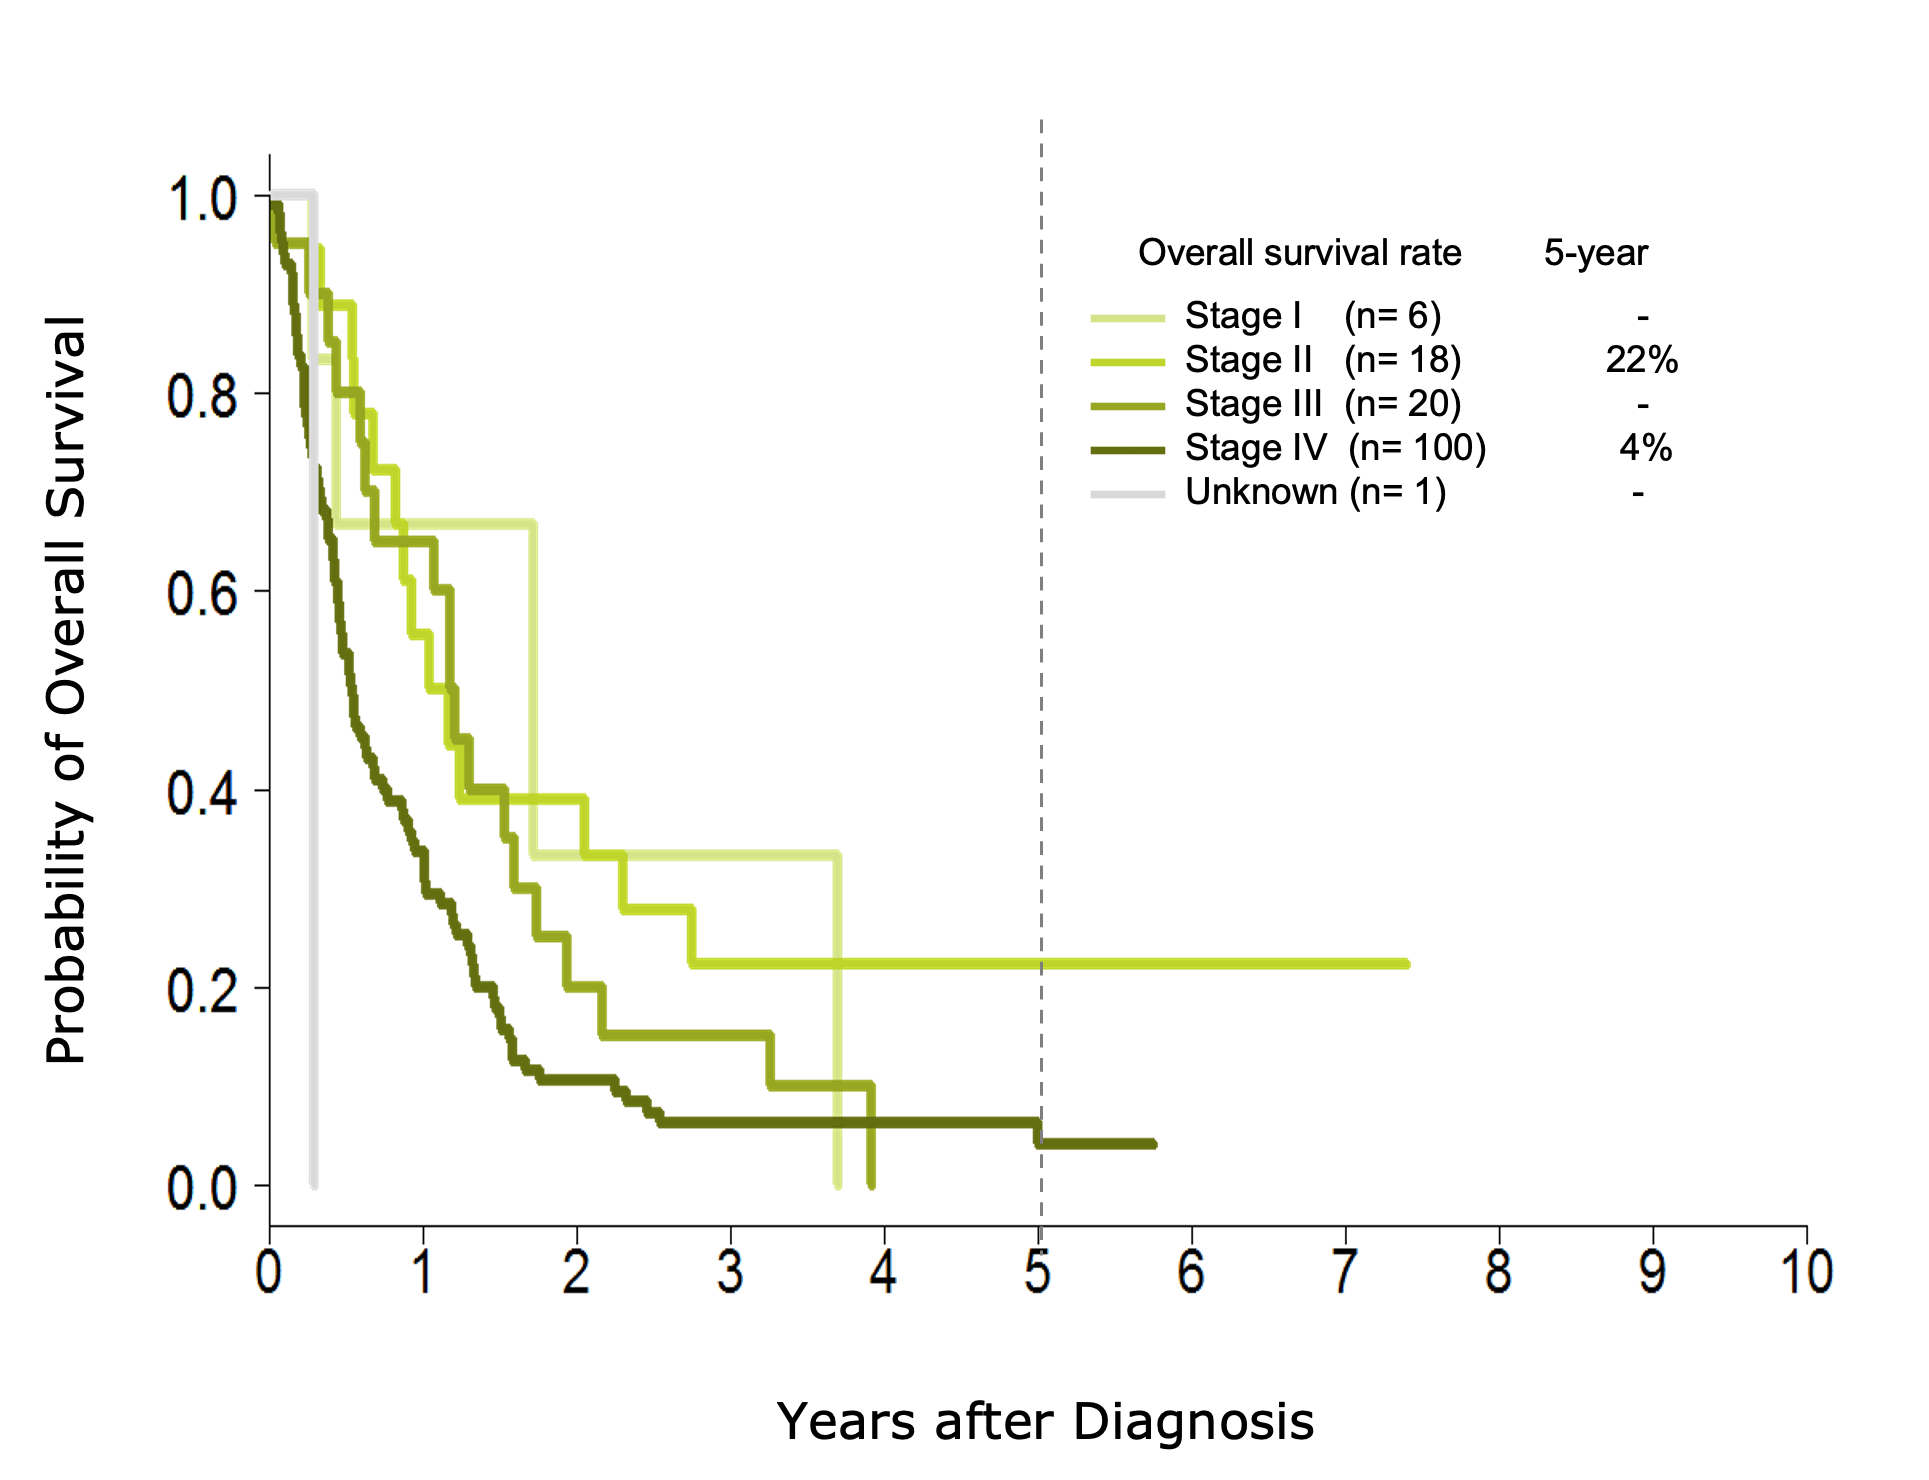
Five-Year Survival Rates of 145 Pancreatic Cancer Patients by Stage (2015-2019)
KFSYSCC’s 2015-2019 five-year observed survival rates for 145 pancreatic cancer patients, stratified by stage, are presented in the following chart. As shown in the graph, the five-year survival rate is 22% for stage 2 and 4% for stage 4.