Leukemia Outcomes at KFSYSCC
Between 2015-2019, the five-year survival rate for leukemia at KFSYSCC was 63.5%.
Basic Information and Leukemia Types out of 483 Leukemia Patients at KFSYSCC from 1990-2019
| Total | 1990-1994 | 1995-1999 | 2000-2004 | 2005-2009 | 2010-2014 | 2015-2019 | |
|---|---|---|---|---|---|---|---|
| n | 483 | 8 (2%) | 38 (8%) | 124 (26%) | 95 (20%) | 121 (25%) | 97 (20%) |
| Gender (%) | |||||||
| Male | 293 (61%) | 4 (50%) | 21 (55%) | 81 (65%) | 56 (59%) | 74 (61%) | 57 (59%) |
| Female | 190 (39%) | 4 (50%) | 17 (45%) | 43 (35%) | 39 (41%) | 47 (39%) | 40 (41%) |
| Age | |||||||
| Mean/Median | 50/52 | 59/64 | 49/55 | 46/46 | 48/48 | 54/57 | 52/54 |
| Range | 2-97 | 31-81 | 2-83 | 2-89 | 7-93 | 3-97 | 6-96 |
| Q1-Q3 | 37-65 | 44-72 | 34-68 | 31-64 | 33-60 | 43-69 | 45-63 |
| Stage (%) | |||||||
| CLL | 58 (12%) | 1 (13%) | 3 (8%) | 6 (5%) | 3 (3%) | 16 (13%) | 29 (30%) |
| CML | 22 (5%) | 0 (0%) | 0 (0%) | 2 (2%) | 3 (3%) | 6 (5%) | 11 (11%) |
| ALL | 54 (11%) | 0 (0%) | 0 (0%) | 8 (6%) | 12 (13%) | 18 (15%) | 16 (16%) |
| AML | 207 (43%) | 2 (25%) | 16 (42%) | 49 (40%) | 55 (58%) | 58 (48%) | 27 (28%) |
| Others | 142 (29%) | 5 (63%) | 19 (50%) | 59 (48%) | 22 (23%) | 23 (19%) | 14 (14%) |
Based on KFSYSCC's cancer registry from 1990 to 2019, there were 483 analytic leukemia cases, with 293 males (61%) and 190 females (39%). The average and median ages were 50 and 52 years old, respectively; the youngest patient was 2 years old, and the oldest was 97 years old; the interquartile range (Q1-Q3) was 37- 65. According to the WHO 2017 classification of hematological cancers, there were 58 cases of CLL (12%), 22 cases of CML (5%), 54 cases of ALL (11%), 207 cases of AML (43%), and 142 cases of other leukemia (29%). The table above presents the basic patient information and stage distribution, categorized by the year of diagnosis.
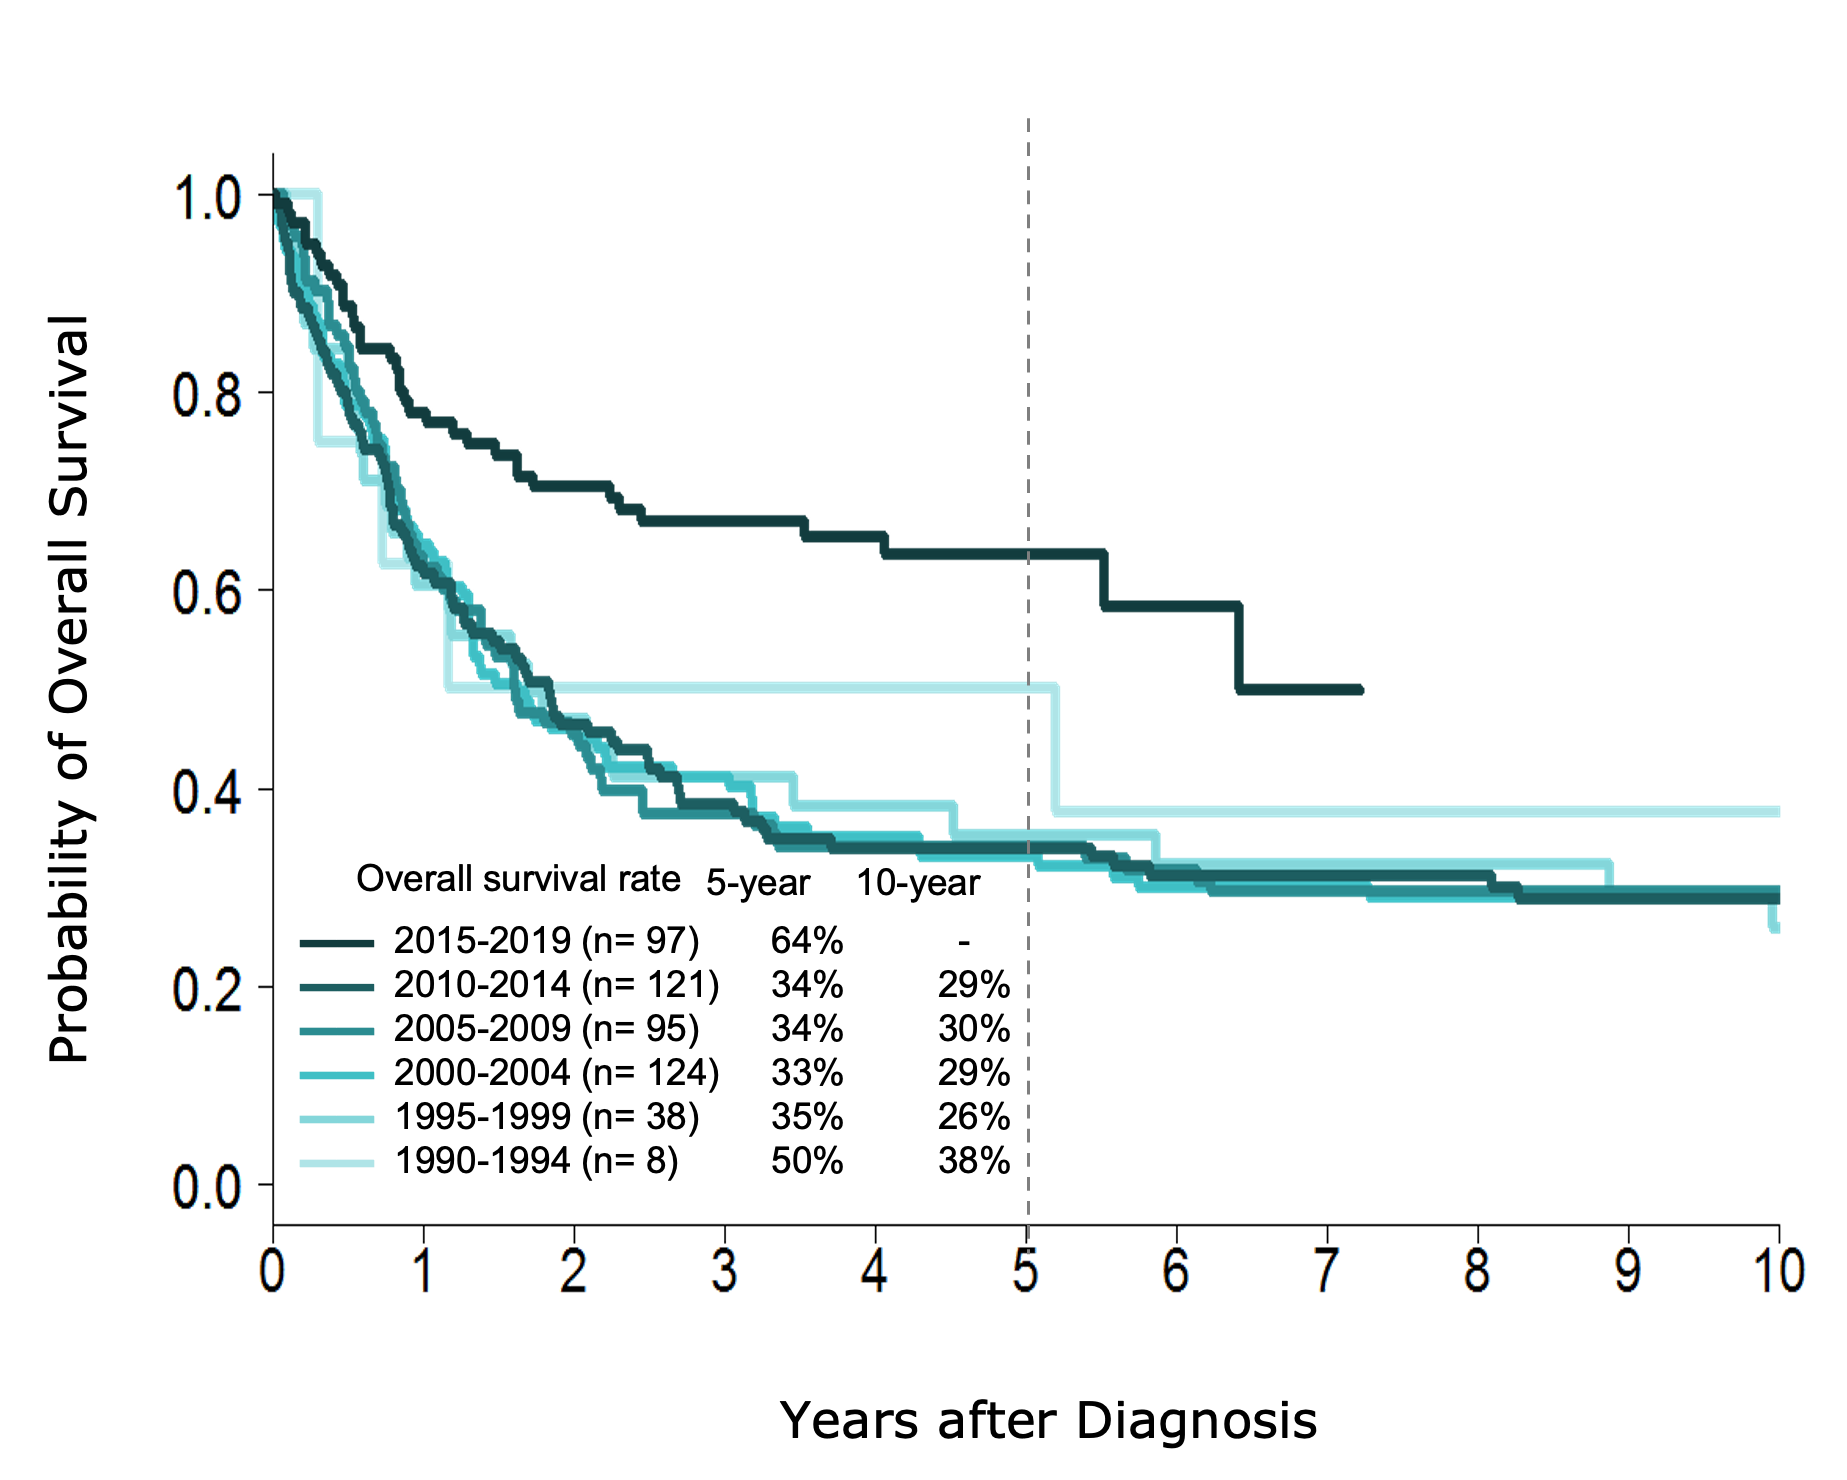
Survival Curves for 483 Leukemia Patients (1990-2019), Stratified by Year of Diagnosis
From 1990 to 2019, the chart below illustrates the five-year observed survival rates for 483 leukemia patients at KFSYSCC, stratified by the year of diagnosis. The graph shows the five-year survival rate for leukemia cancer increased from 50% in 1990-1994 to 64% in 2015-2019, while the ten-year survival rate decreased from 38% in 1990-1994 to 29% in 2010-2014.
Treatment Methods and Stages for 97 Leukemia Patients at KFSYSCC (2015-2019)
| Treatment/Condition | Total | CLL | CML | ALL | AML | Other |
|---|---|---|---|---|---|---|
| Total | 97 | 29 | 11 | 16 | 27 | 14 |
| Surgical Treatment | 0 (0%) | - | - | - | - | - |
| Radiation Therapy | 1 (1%) | 0 (0%) | 0 (0%) | 0 (0%) | 1 (4%) | 0 (0%) |
| Chemotherapy | 60 (62%) | 9 (31%) | 1 (9%) | 16 (100%) | 27 (100%) | 7 (50%) |
| Targeted Therapy | 22 (23%) | 7 (24%) | 11 (100%) | 1 (6%) | 1 (4%) | 2 (14%) |
| Hormone Therapy | 7 (7%) | 2 (7%) | 0 (0%) | 5 (31%) | 0 (0%) | 0 (0%) |
| Immunotherapy | 0 (0%) | - | - | - | - | - |
| Palliative Care | 7 (7%) | 0 (0%) | 0 (0%) | 3 (19%) | 2 (7%) | 2 (14%) |
| Bone Marrow/Stem Cell Transplant | 14 (14%) | 0 (0%) | 0 (0%) | 4 (25%) | 9 (33%) | 1 (7%) |
| No Record of Initial Treatment Reported | 23 (24%) | 20 (69%) | 0 (0%) | 0 (0%) | 0 (0%) | 3 (21%) |
Between 2015 and 2019, there were a total of 97 analytic leukemia cancer cases, including X29 patients with CLL, 11 patients with CML, 16 patients with ALL, 27 patients with AML, and 14 patients with other leukemias. In terms of treatment methods, 1 patients (1%) received radiation therapy, 60 (62%) underwent chemotherapy, 22 (23%) received targeted therapy, 7 (7%) received hormone therapy, 7 (7%) underwent palliative care, 14 (14%) receive bone marrow or stem cell transplantation, and 23 (24%) had not record of initial treatment reported.
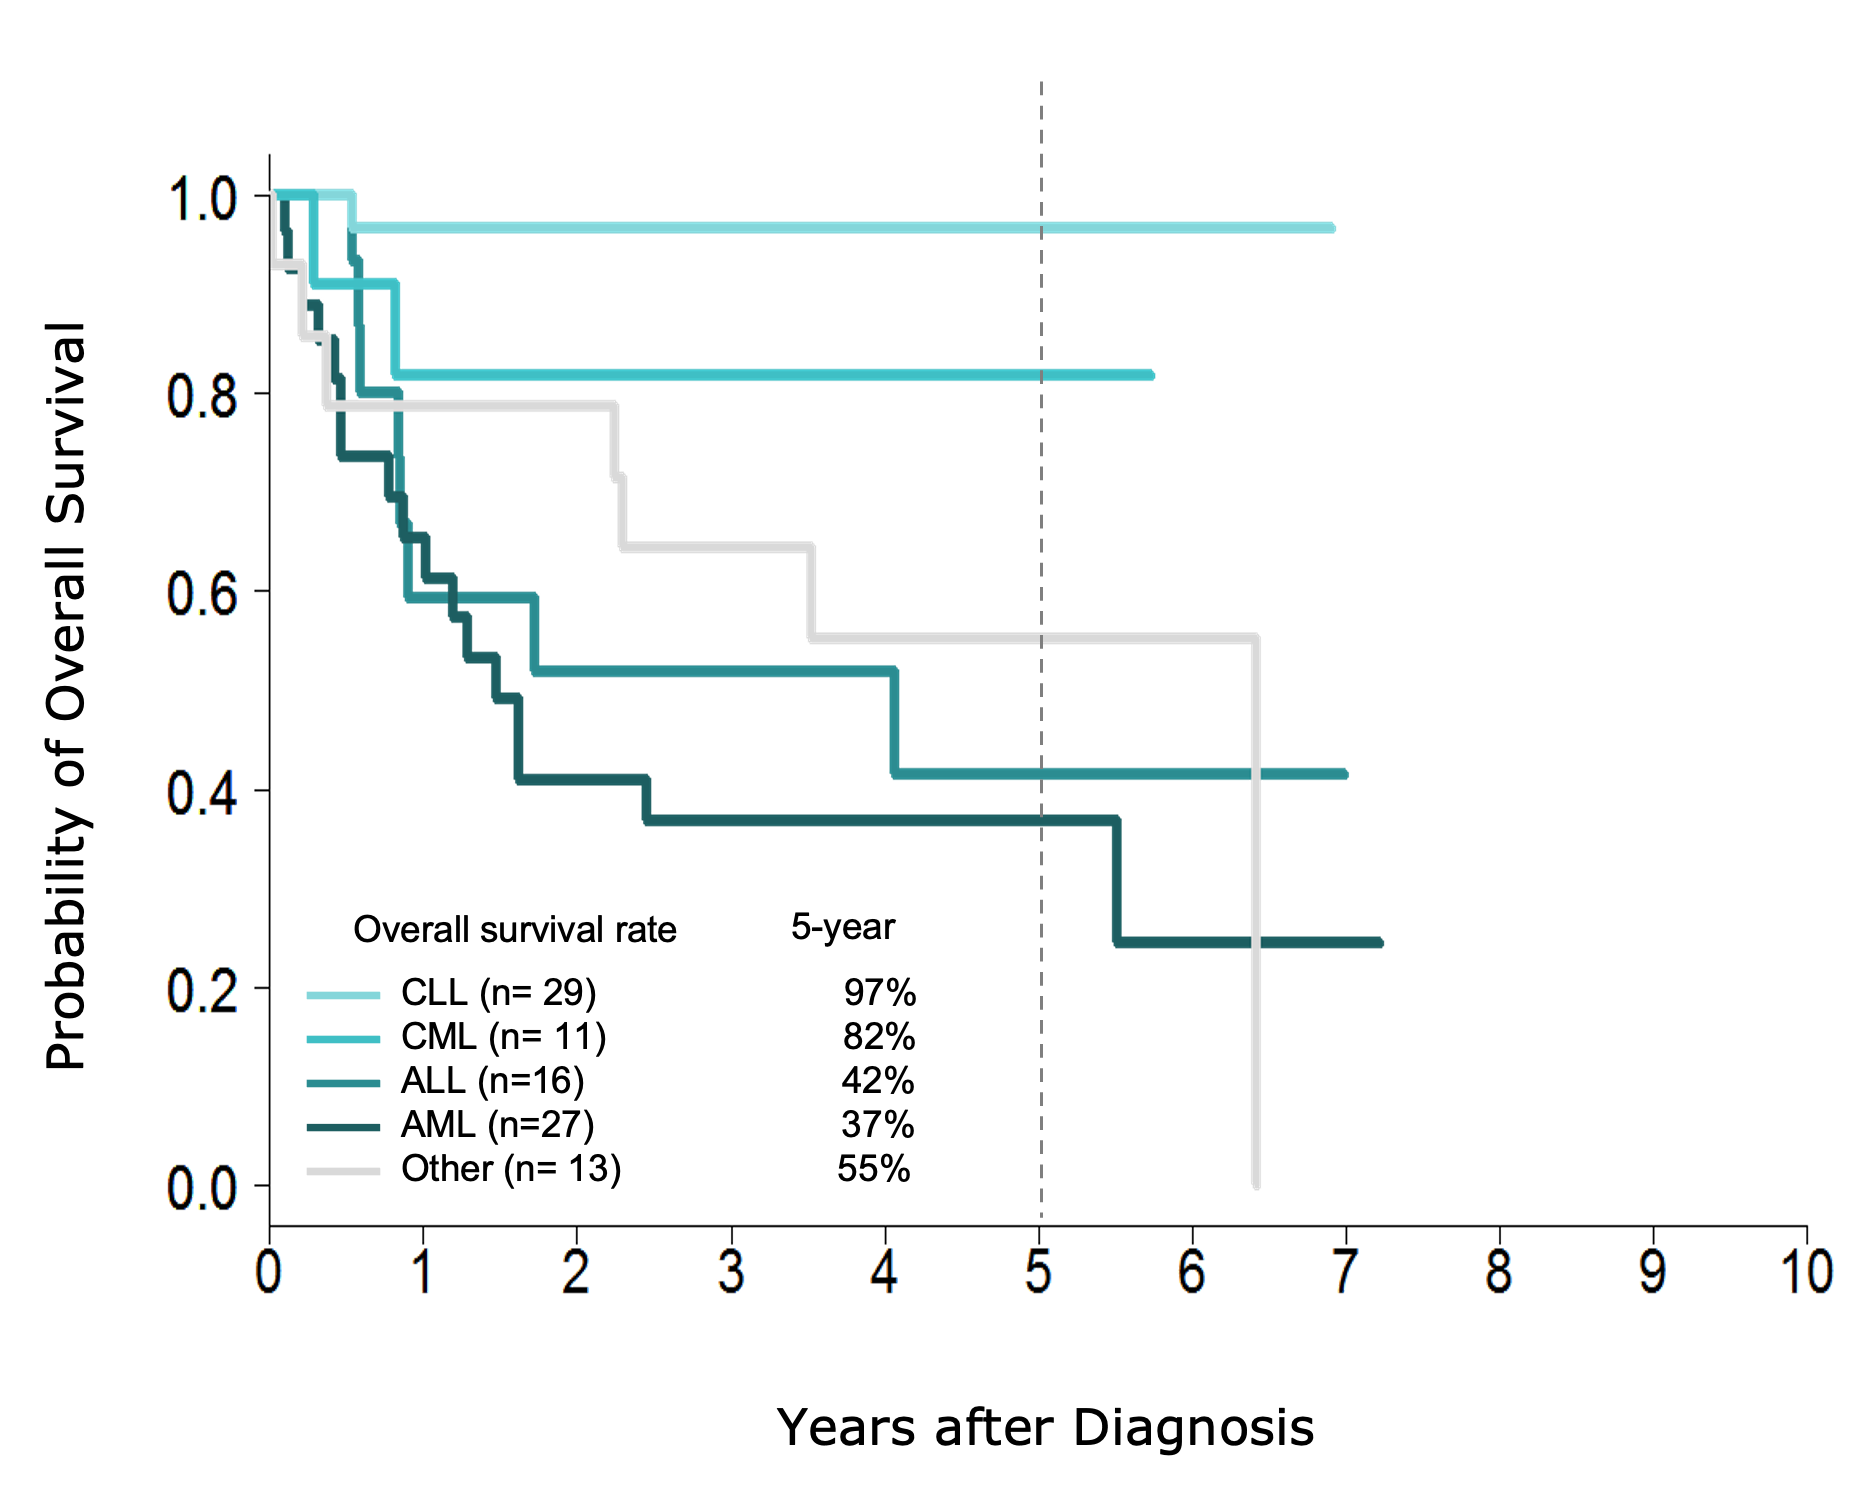
Five-Year Survival Rates of 97 Leukemia Patients by Stage (2015-2019)
KFSYSCC’s 2015-2019 five-year observed survival rates for 97 leukemia patients, stratified by leukemia type, are presented in the accompanying chart. As shown in the graph, the five-year survival rate is 97% for CLL, 82% for CML, 42% for ALL, 37% for AML, and 55% for other leukemias.