
Kidney Cancer Outcomes at KFSYSCC
Between 2015-2019, the five-year survival rate for kidney cancer at KFSYSCC was 75.1%.
Basic Information and Stage Distribution of 526 Kidney Cancer Patients at KFSYSCC from 1990-2019
| Total | 1990-1994 | 1995-1999 | 2000-2004 | 2005-2009 | 2010-2014 | 2015-2019 | |
|---|---|---|---|---|---|---|---|
| n | 526 | 10 (2%) | 45 (9%) | 121 (23%) | 116 (22%) | 123 (23%) | 111 (21%) |
| Gender (%) | |||||||
| Male | 338 (64%) | 7 (70%) | 26 (58%) | 73 (60%) | 75 (65%) | 83 (67%) | 74 (67%) |
| Female | 188 (36%) | 3 (30%) | 19 (42%) | 48 (40%) | 41 (35%) | 40 (33%) | 37 (33%) |
| Age | |||||||
| Mean/Median | 58/59 | 60/64 | 59/62 | 58/61 | 59/58 | 55/56 | 58/59 |
| Range | 3-91 | 35-72 | 32-87 | 3-88 | 14-89 | 16-91 | 20-86 |
| Q1-Q3 | 48-68 | 53-70 | 50-67 | 48-70 | 48-71 | 46-64 | 49-68 |
| Stage (%) | |||||||
| 0 | 1 (0.2%) | 0 (0%) | 0 (0%) | 1 (1%) | 0 (0%) | 0 (0%) | 0 (0%) |
| I | 209 (40%) | 2 (20%) | 7 (16%) | 34 (28%) | 50 (43%) | 57 (46%) | 59 (53%) |
| II | 37 (7%) | 1 (10%) | 4 (9%) | 12 (10%) | 9 (8%) | 7 (6%) | 4 (4%) |
| III | 106 (20%) | 1 (10%) | 4 (9%) | 12 (10%) | 29 (25%) | 37 (30%) | 23 (21%) |
| IV | 102 (19%) | 2 (20%) | 12 (27%) | 27 (22%) | 19 (16%) | 19 (15%) | 23 (21%) |
| Unknown | 71 (14%) | 4 (40%) | 18 (40%) | 35 (29%) | 9 (8%) | 3 (2%) | 2 (2%) |
Based on KFSYSCC's cancer registry from 1990 to 2019, there were 526 analytic kidney cancer cases, with 338 males (64%) and 188 females (36%). The average and median ages were 58 and 59 years old, respectively; the youngest patient was 3 years old, and the oldest was 91 years old; the interquartile range (Q1-Q3) was 48-68. By stage, there were 1 stage 0 kidney cancer patients (0.2%), 209 stage I patients (40%), 37 stage II patients (7%), 106 stage III patients (20%), and 102 stage IV patients (19% The basic information and stage distribution of all kidney cancer patients, sorted by the year of diagnosis, are presented in the table above.

Survival Curves for 526 Kidney Cancer Patients (1990-2019), Stratified by Year of Diagnosis
From 1990 to 2019, the chart illustrates the five-year observed survival rates for 526 kidney cancer patients at KFSYSCC, stratified by the year of diagnosis. The graph shows the five-year survival rate for kidney cancer increased from 40% in 1990-1994 to 75% in 2015-2019, while the ten-year survival rate rose from 20% in 1990-1994 to 72% in 2010-2014.
Treatment Methods and Stages for 111 Kidney Cancer Patients at KFSYSCC (2015-2019)
| Category | Total | Stage I | Stage II | Stage III | Stage IV | Unknown |
|---|---|---|---|---|---|---|
| Total | 111 | 59 | 4 | 23 | 23 | 2 |
| Surgical Treatment | 96 (86%) | 59 (100%) | 4 (100%) | 21 (91%) | 10 (43%) | 2 (100%) |
| Radiation Therapy | 10 (9%) | 0 (0%) | 0 (0%) | 1 (4%) | 9 (39%) | 0 (0%) |
| Chemotherapy | 5 (5%) | 0 (0%) | 0 (0%) | 2 (9%) | 3 (13%) | 0 (0%) |
| Targeted Therapy | 14 (13%) | 0 (0%) | 0 (0%) | 1 (4%) | 13 (57%) | 0 (0%) |
| Hormone Therapy | 0 (0%) | - | ||||
| Immunotherapy | 2 (2%) | 0 (0%) | 0 (0%) | 0 (0%) | 2 (9%) | 0 (0%) |
| Palliative Care | 8 (7%) | 0 (0%) | 0 (0%) | 1 (4%) | 7 (30%) | 0 (0%) |
| Bone Marrow/Stem Cell Transplant | 0 (0%) | - | ||||
| No Record of Initial Treatment Reported | 0 (0%) | - | ||||
Between 2015 and 2019, there were a total of 111 analytic kidney cancer cases, including 59 patients in stage I, 4 in stage II, 23 in stage III, and 23 in stage IV. In terms of treatment methods, 96 patients (86%) underwent surgical treatment, 10 (9%) received radiation therapy, 5 (5%) underwent chemotherapy, 14 (13%) received targeted therapy, 2 (2%) received immunotherapy, and 8 (7%) underwent palliative care.
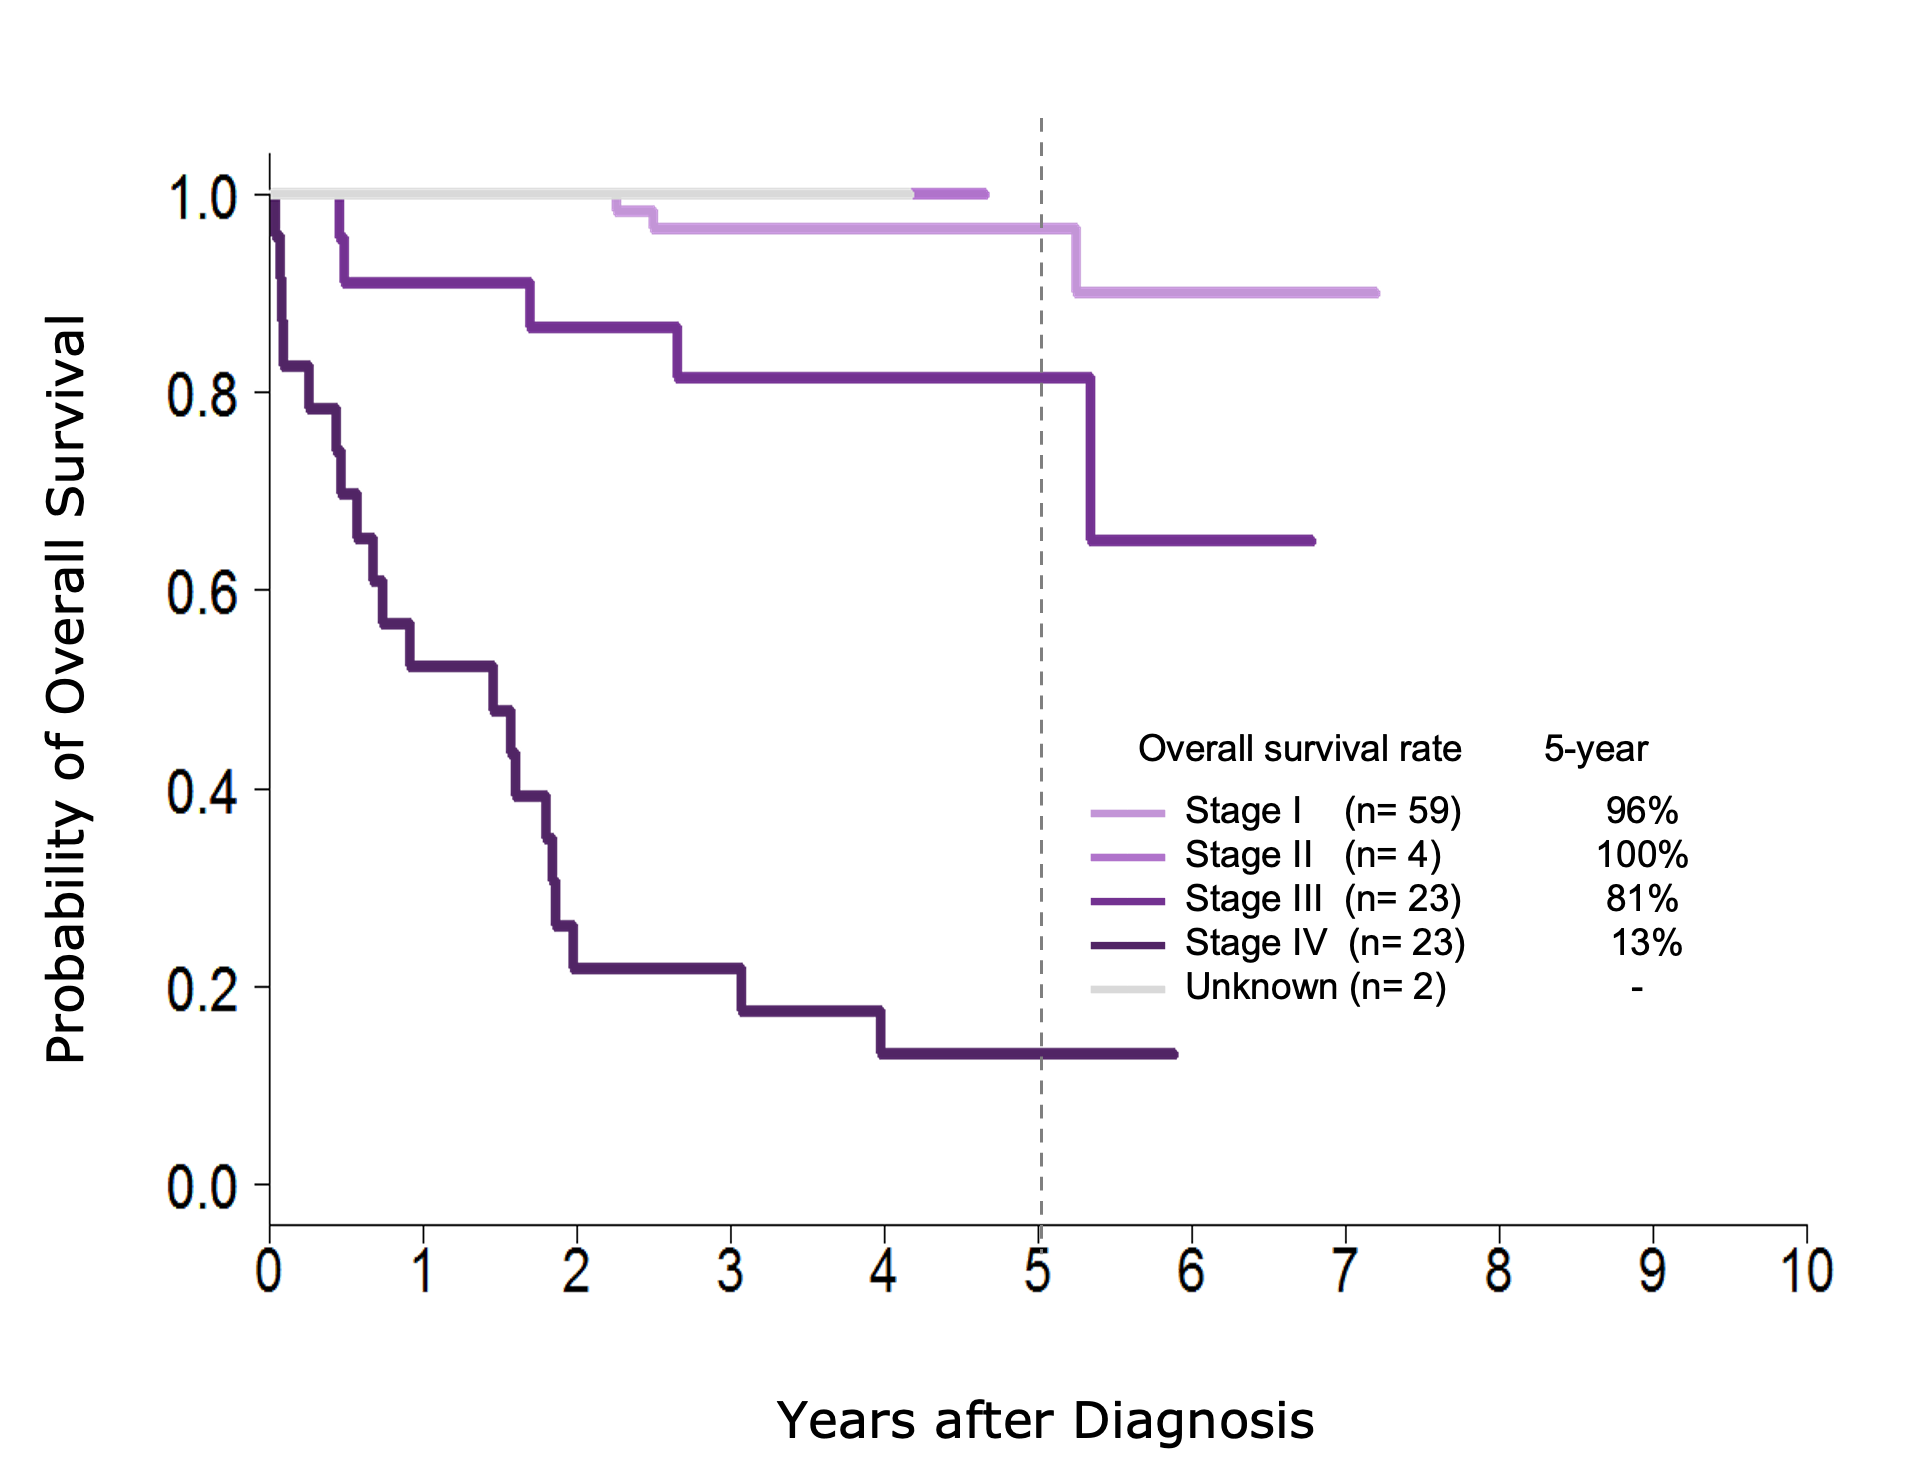
Five-Year Survival Rates of 111 Kidney Cancer Patients by Stage (2015-2019)
KFSYSCC’s 2015-2019 five-year observed survival rates for 111 kidney cancer patients, stratified by stage, are presented in the following chart. As shown in the graph, the five-year survival rate is 96% for stage 1, 100% for stage 2, 81% for stage 3, and 13% for stage 4.